Drobo is gone. Your Drobo isn't.
Recovering firmware, adding services, and reading your own drives on a NAS whose manufacturer no longer exists.
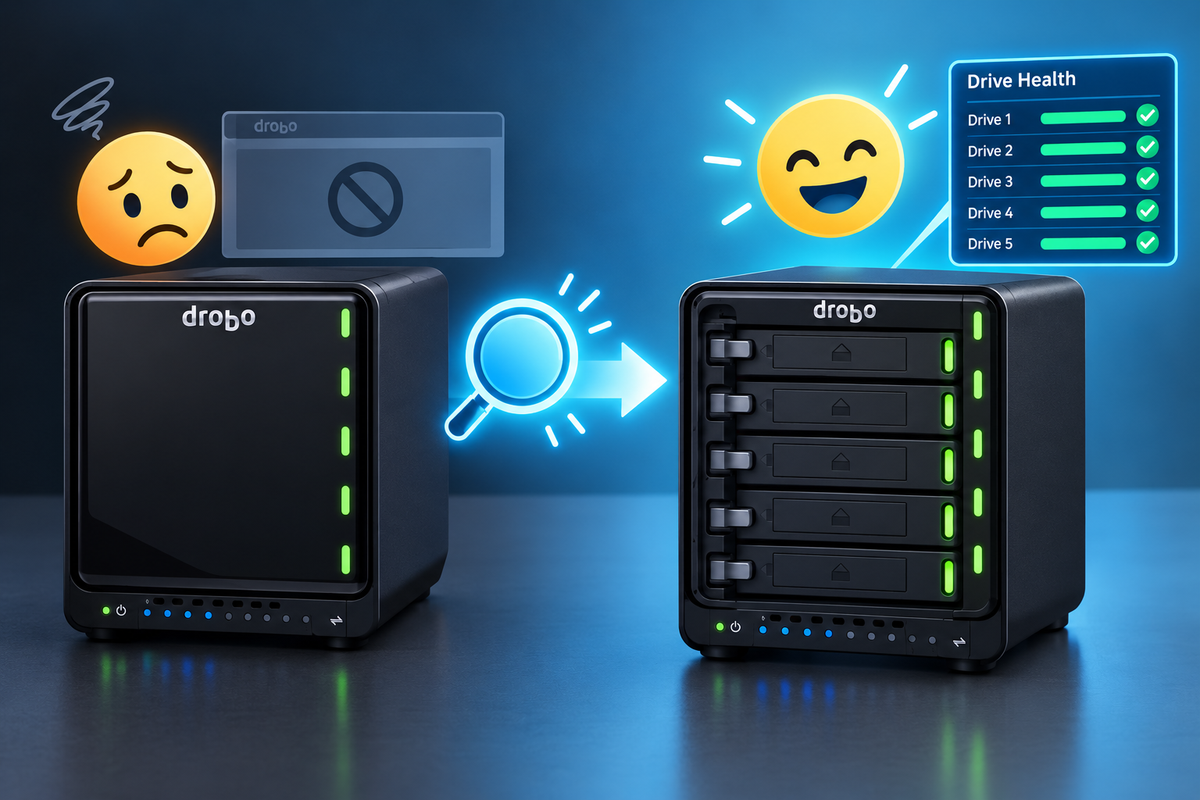
Storcentric — which owned Drobo — went bankrupt in 2023. The update servers went dark. Drobo Dashboard, the Windows application that was the only way to see your drives, talks to a support infrastructure that isn't there any more.
And yet the hardware works. Mine has been in continuous service since 2019 — seven years, three of them after the company that built it ceased to exist — and it currently holds 19 TiB without complaint.
This is what I've worked out about keeping one alive: where to get the firmware and apps now that the servers are gone, how to add and supervise your own services, and — the part I didn't expect — how to read full per-drive health without Dashboard at all.
Everything below was done on a Drobo 5N2 running firmware 4.3.1. Other NAS models are likely similar; I've only had one to test.
1. First, get the archive
This is the single most important thing in this article, and the hardest to find.
Before updates.drobo.com went offline, somebody mirrored it. The whole thing — firmware for every model, every version, plus the DroboApps catalogue. It exists as a torrent, and as far as I can tell the only public reference to it was buried in the sub-comments of one old Reddit thread.
magnet:?xt=urn:btih:f69847e6f62d92dd5871554e3136e0c2410a1e62&dn=updates.drobo.com-20221125.tar.gz
- 11,833,976,596 bytes (11.02 GiB), 45,144 × 256 KiB pieces
- mirrored 2022-11-25, before the servers went down
Several of the trackers baked into it are themselves dead now (9.rarbg.to, predictably), so it relies on peers.
It is alive. I've been seeding it since October 2023, and in those 2.9 years it has uploaded 310 GiB — about 28 complete copies, roughly ten a year.
Sit with that number for a second. Ten people a year, worldwide, have found the only public mirror of firmware for a product that sold in the hundreds of thousands. Not because demand is low, but because the only reference to it was buried in the sub-comments of one Reddit thread. That's the entire reason this article exists.
If you get it, keep seeding it. This is a small population of people keeping each other's hardware alive, and the archive only survives as long as somebody is sharing it.
Extracted, it's 13 GB and 1,205 files:
| what | where |
|---|---|
| firmware, all models | updates.drobo.com/<MODEL>/firmware/release.*.tdf |
| 11 versions for the 5N2 alone | updates.drobo.com/5N2/firmware/ |
| the DroboApps catalogue | updates.drobo.com/droboapps/2.0/ and 2.1/ |
| kernel modules per model & kernel | updates.drobo.com/droboapps/kernelmodules/ |
| Dashboard installers | 1.6.7 through 1.8.3 |
Note what is not there: source code. Not a line. No GPL source drop, despite u-boot being shipped in the firmware. The billofmaterials_*.txt files are file manifests — name, size, MD5 — not software bills of materials, so they don't even tell you what's inside.
2. Getting in
SSH is a DroboApp (dropbear). If it's already enabled, you log in as admin with your Dashboard password — not root. Root login is refused.
sudo works but requires the password, so you can't script privileged actions without storing it somewhere. I keep mine in a mode-600 file read by a single wrapper script that only knows a fixed list of allowed actions, rather than handing anything a general-purpose root shell. On a box holding the only copy of some of my data, that felt proportionate.
What this machine actually is
Worth internalising before you change anything:
| CPU / kernel | ARMv7, Linux 3.2.96, monolithic — no loadable storage modules |
| init | BusyBox init reading /etc/inittab. No systemd. No cron at all. |
/ |
jffs2, read-only |
/etc, /bin |
aufs over tmpfs — ephemeral. Wiped every reboot. |
/var |
7 MB jffs2 flash — persistent |
/mnt/DroboFS |
ext4 — the array, and the only real persistent storage |
That third row is the one that catches people. Every "just add a cron job / edit sudoers / drop an init script" answer is wrong on this machine. It works until the next reboot and then silently vanishes, which is worse than not doing it, because you'll believe you have a thing you don't.
3. Adding a service — the mechanism is a directory
DroboApps are started at boot by DroboApps.sh, whose start_apps() simply scans /mnt/DroboFS/Shares/DroboApps/ and runs every service.sh it finds.
That directory is on the array, so it persists. Which means:
An app directory is the only durable boot hook on a Drobo.
You don't need the vendor's installer or its catalogue UI. Unpack an app's .tgz from the archive into that directory and it starts at the next boot. That's how I added NFS to a machine whose vendor can no longer sell it to me.
A minimal app is just a directory containing a service.sh that sources /etc/service.subr and defines start() and stop().
4. Supervising a service — monit is already there
Nothing restarts a DroboApp if it dies. Mine ran three weeks, was killed mid-download, and simply stayed dead — the array was fine, the service was gone, and nothing noticed.
But the box ships monit, respawned from /etc/inittab. And the stock nfs app demonstrates the pattern: it bundles its own monit binary and config, and declares daemon="${prog_dir}/libexec/monit".
So the durable way to supervise anything is a small app of your own that runs an app-local monit. Mine watches nzbget:
check process nzbget
  matching "nzbget"
  start program = "/mnt/DroboFS/Shares/DroboApps/nzbget/service.sh start"
  if failed host 127.0.0.1 port 6789 protocol http for 3 cycles then restart
  if 5 restarts within 10 cycles then unmonitor
Two things I'd urge you to copy:
- Check the port, not just the process. A service can be alive and wedged, and a bare process check calls that healthy.
- Give up rather than loop.
if 5 restarts within 10 cycles then unmonitor. If the real cause is memory pressure, an unbounded watchdog restarts the service into the same wall every 30 seconds, making the box worse while hiding the fault.
One trap that cost me an hour
The system monitrc contains set init, which tells monit not to daemonize — init supervises it in the foreground. Start it over SSH and it holds your session open, then dies when the session ends. It looks exactly like a crash. Your own app's monitrc should omit that line.
5. Reading your drives without Dashboard
Here's the part I didn't expect.
The Drobo hides its disks completely. Linux inside sees one large virtual LUN and no /dev/sdb..sde. No SMART, no serials, no per-drive anything. That was the whole reason Dashboard existed.
I went looking for the protocol the hard way — pulled the Dashboard installers out of the archive, only to find 99 MB of InstallShield-compressed payload. Then I looked at the other end of the conversation, which was sitting on a box I already had a shell on.
nasd is the daemon Dashboard talks to. It's stripped ARM ELF, but its command enum is in plaintext:
$ strings /usr/sbin/nasd | grep -oE 'eCmd[A-Za-z]+' | sort -u | wc -l
105
Including eCmdGetAllDevicesStatusXML, eCmdGetSysInfo, eCmdGetFanInfo, eCmdGetFirmwareInfo.
It listens on TCP 5000. And on connect — with no authentication, no TLS, and without being asked — it pushes a complete status document:
+-------------+----------+------------------+-------------+-----+
| "DRINASD\0" | version  | length           | UTF-8 XML   | NUL |
| 8 bytes     | 4 bytes  | 4 bytes, BIG-END |             |     |
+-------------+----------+------------------+-------------+-----+
Two details that will cost you an hour each:
- The length is big-endian. Read it little-endian on x86 and a 7 KB frame looks like 2.7 GB, so your read blocks until timeout instead of failing.
- The payload is NUL-terminated and the length includes the NUL. Hand it straight to an XML parser and you get
not well-formed (invalid token)pointing at a line past the closing root tag.
Get those right and you have everything Dashboard shows:
Drobo 5N2   status 0
  capacity 20.97 TB used of 27.80 TB protected  (75.4%)

  slot type     capacity  model                       fw        err
  0    HDD       6.00 TB  SEAGATE ST6000VN0033-2EE    SC60        0
  1    HDD       8.00 TB  TOSHIBA HDWN180 SATA        GX2M        0
  2    HDD       8.00 TB  SEAGATE ST8000VN004-3CP1    SC60        0
  3    HDD       6.00 TB  SEAGATE ST6000VN0033-2EE    SC60        0
  4    HDD       8.00 TB  SEAGATE ST8000VN004-2M21    SC60        0
  5    mSATA     0.26 TB  Vaseky V800/256GSATA        S0628A0     0
Per-slot: model, serial, firmware revision, capacity, error count, disk state, SSD life remaining. Array-level: total/used/free protected capacity, disk pack ID and status. The capacity figures match esa vxphyscapacity byte-for-byte, which is a nice independent check.
mTemperature exists in the XML and reads 0 on every slot on my unit. Don't build a temperature alert on it — a metric that's structurally always zero looks like coverage while providing none.
The tool is about 130 lines of Python 3, standard library only, and it is read-only by construction: it reads one frame and never sends a byte. That's deliberate, because eCmdInsertDrive and eCmdRemoveDrive sit in the same enum as the harmless getters. Anything you build on this should allowlist the Get* verbs rather than exposing a general command channel.
A note on that open port
Anything on your LAN can read your drive serials, models and capacities from port 5000 with no credentials. That's how Dashboard was designed to work and it's unremarkable on a trusted network — but don't expose that port, and be aware it's there. There's no patch coming and nobody to report it to.
6. What about drobo-utils?
drobo-utils is the established open-source Drobo tool and it's worth knowing about — but it won't help you here. It drives direct-attached Drobos through SCSI passthrough to a /dev/sdX node. NAS models have no such node on the client and were never on its supported list. Its author has said he no longer has hardware to test with.
Different transport, different product line. Not a fork.
7. The part I haven't done: authenticating
Everything above is read-only in a specific way — the tool never sends a command. It opens the socket and reads the document nasd volunteers. That is one behaviour out of 105, and 42 of those are Get*.
Two of the others are eCmdAuthenticateUser and eCmdDeviceLogin. The binary also references PAM and /etc/shadow, which fits what Dashboard does when it asks for the admin password before showing you services, shares and settings. So there is a whole authenticated surface here that I have not touched.
I'm not going to guess at it. The same enum holds Format, Remove and Force verbs, and mine is a live array with 19 TiB on it — fuzzing a storage daemon is how people lose arrays. The honest way in is to put a working Dashboard session on the wire and read the framing off a real exchange rather than inferring it from a strings dump. There is a second listener on 5001 that I also can't account for yet.
That's the next article.
What I'd tell you if you own one of these
Keep it running, but don't build your future on it. Mine is healthy — five drives, zero errors, 75% full — and I still assume it's a depreciating asset. The replacement question is a separate article, but briefly: the thing that made Drobo special (mixed drive sizes, add a disk and forget about it, single-disk redundancy) is no longer rare. Unraid does it, Synology's SHR does it, and btrfs raid1 does it for free if you can spare 50% of your capacity.
Meanwhile: seed the torrent, keep your firmware locally, and know that your drives were visible all along.
Tool and protocol notes: github.com/jerimiah797/drobo-nas-protocol. Tested against one Drobo 5N2 on firmware 4.3.1 — corrections from other models very welcome.